Composite User Experience Investigation
Research is based on eyetracking and introspection.
Method allows to aggregate the qualitative and quantitative data to build a highly reliable assessment for graphic interface.
Investigation and analyzing capabilities
Aggregation of eyetracking data and declarative evaluation allows to analyze the value of assessment indicators in context of awareness „what the user saw and recorded" and „what he did not detect or ignored".
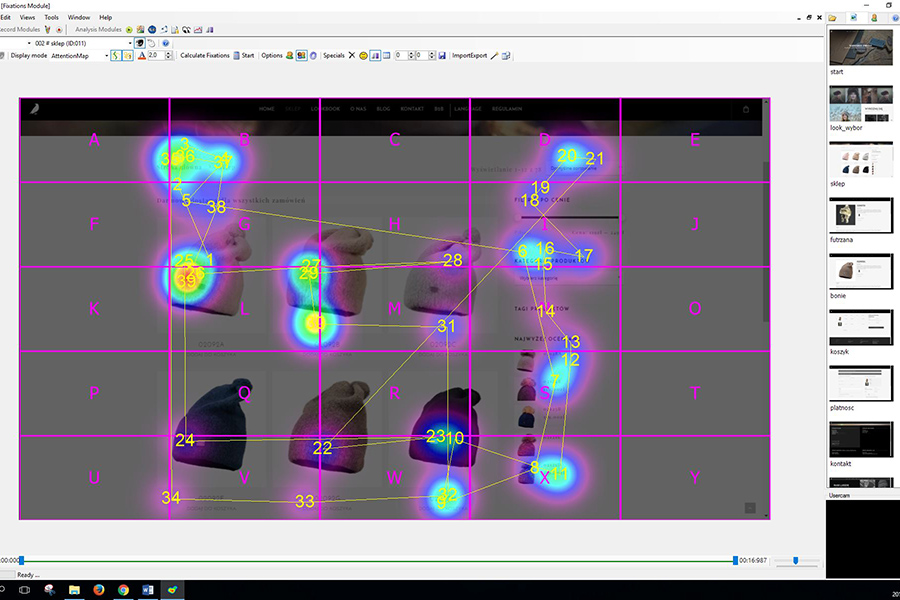
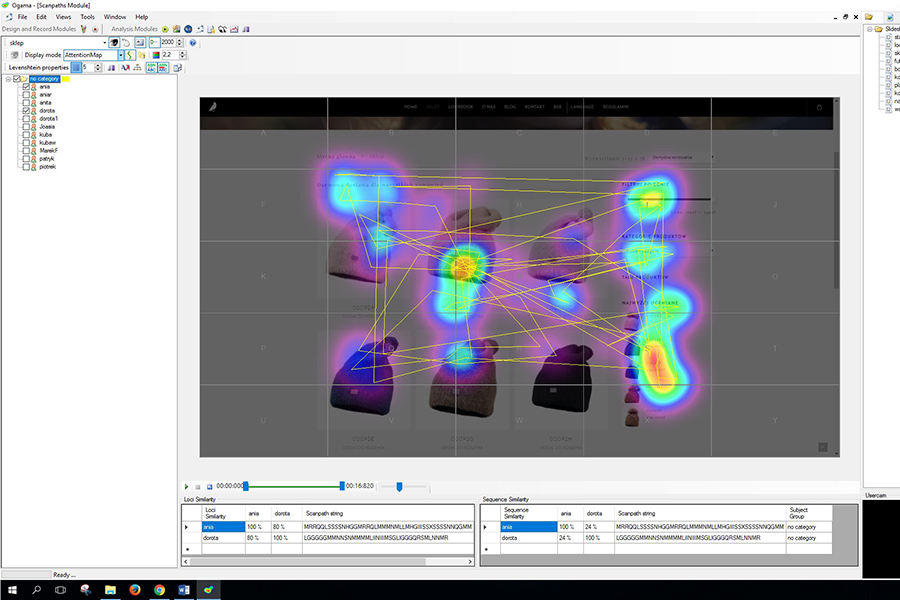
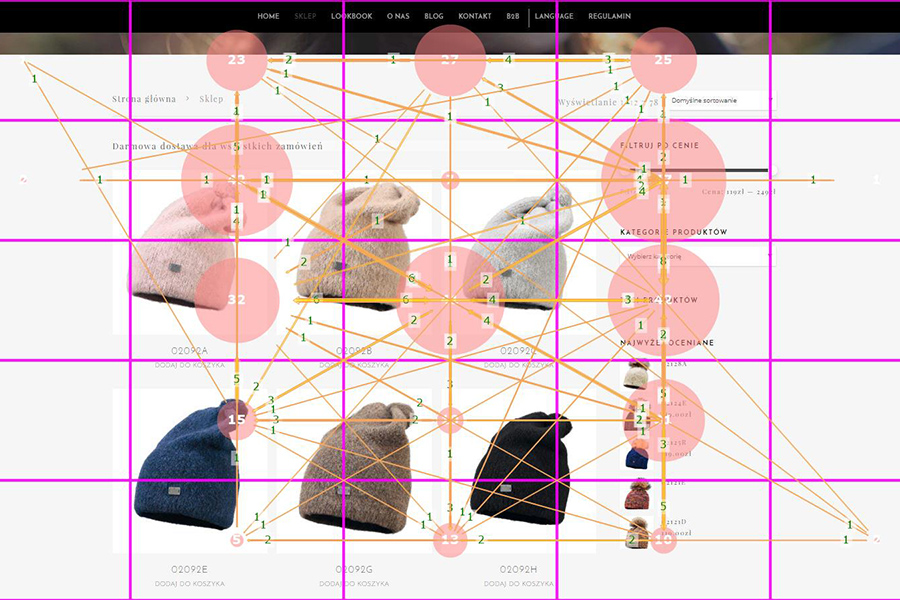
Screen-based eyetracking study
Stand-alone application optimized for the analysis of slide show based stimulus presentation. It supports most of the commonly used qualitative analysis and visualization possibilities in the field of eye tracking research with tools for a quantitative look at the data.
- Storing gaze and mouse tracking data in sql local data files that are created for each experiment
- Recording and analyzing gaze and mouse movement data together
- Six different stimulus types for creating presentation trial. Ability to calculate connectings between mouse and gaze data
- Hierarchical order trial sequence depicted in a tree view and timeline
- Slide options to modify different wide properties: naming, timing, testing, targets or links
- Visual-guided data mining through the use of different visual representations
- Reply – To reply the data logged during an investigation
- Fixations – To recalculate, store and display the gaze and mouse fixations made by the subjects
- Saliency – Possibility to compare recorded human scan paths with the scan path generated by a computational model of vision
- Scan path – To visualize data of multiple subjects in one place
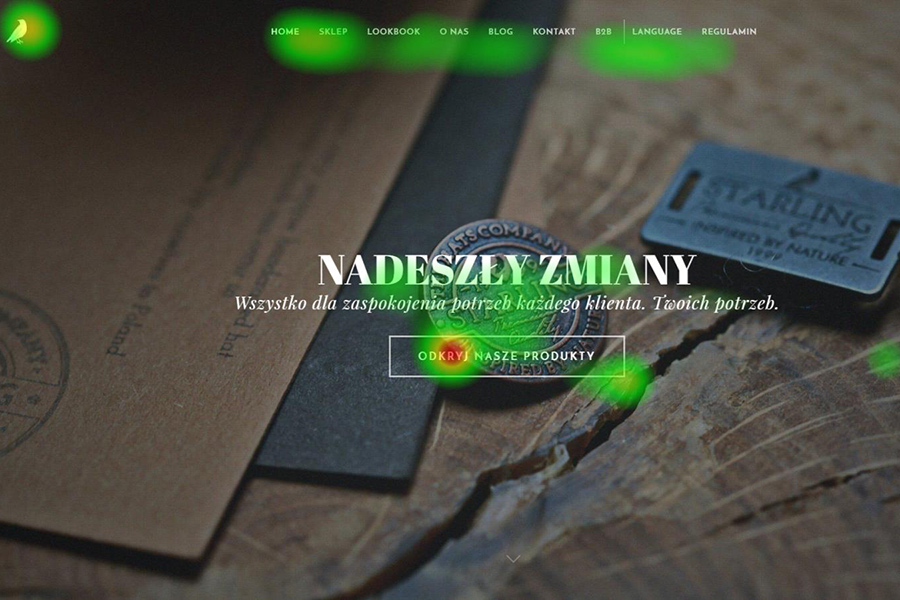
- Attention maps – To visualize merged fixation data from selected subjects and to build averaged maps across a subset of (or all) subjects
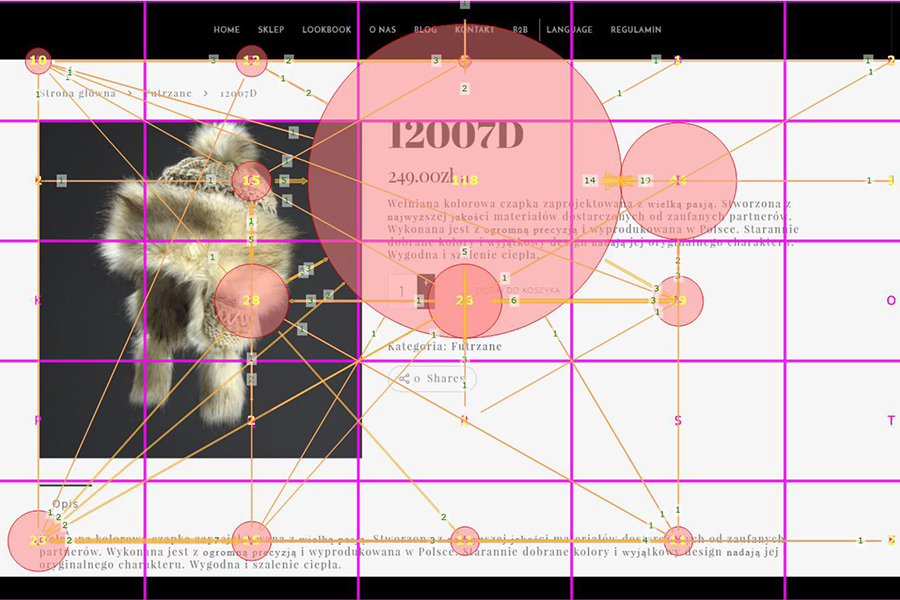
- Areas of Interest – To define and display different (AOI). Three parameters of fixation: complete fixation time, number of fixations, average fixation duration and transition arrows can be calculated for any AOI
- Statistics – To calculate empirical parameters for further analyses
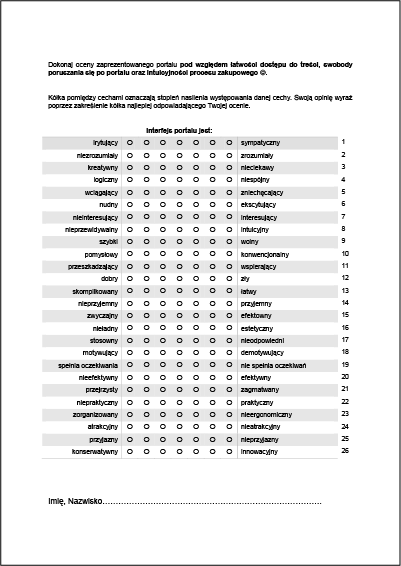
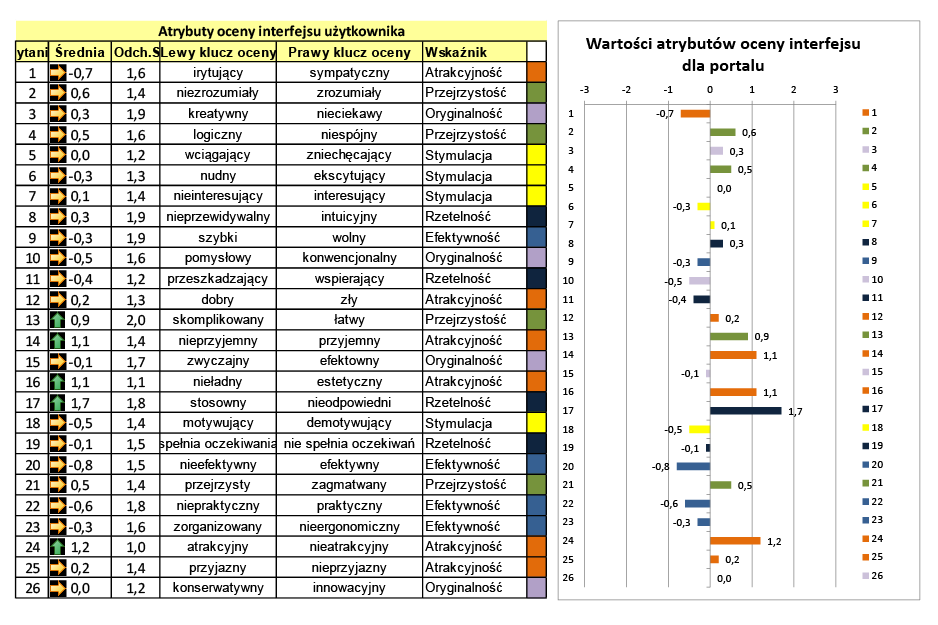
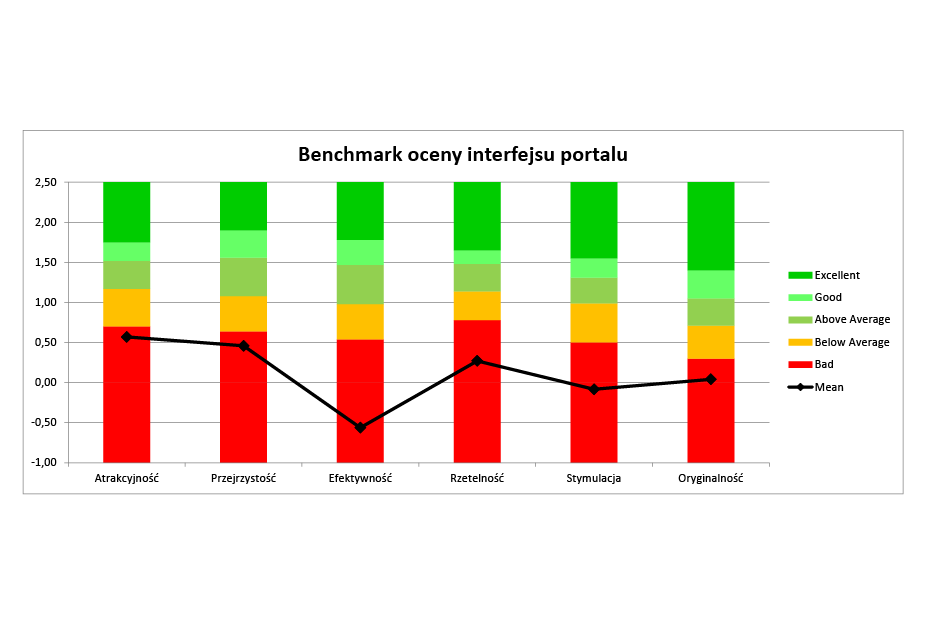
User Experience Questionnaire
Method is used to collect some quantitative data about the impression of the participants concerning User Experience. The questionnaire is handle to the participants directly after they finished working on the test tasks. The goal is to catch the immediate impression of a user towards a product.
- Each selection in questionnaire is represented by two terms with opposite meanings and contains a seven-level scale
- The order of the terms is randomized per selection
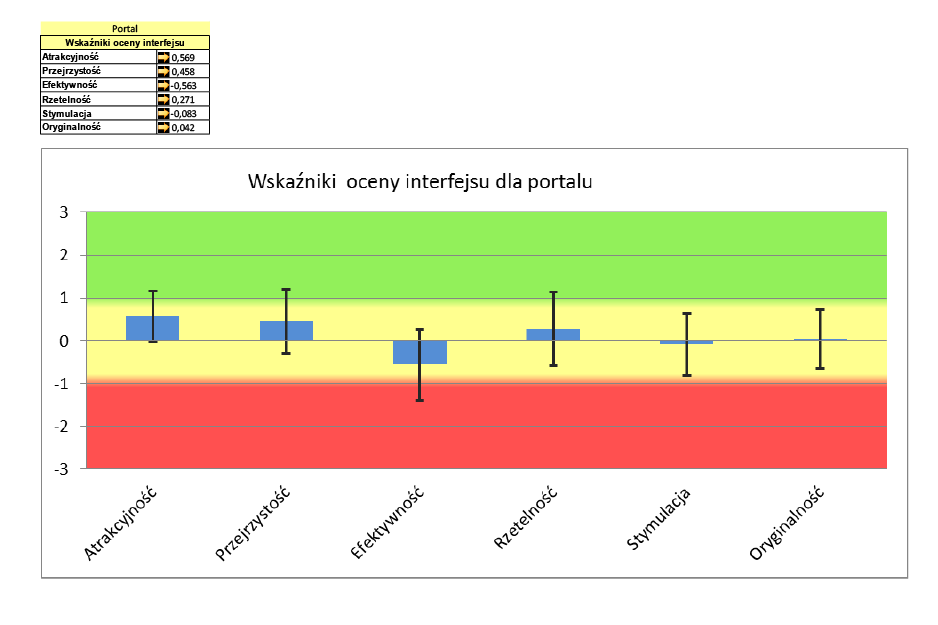
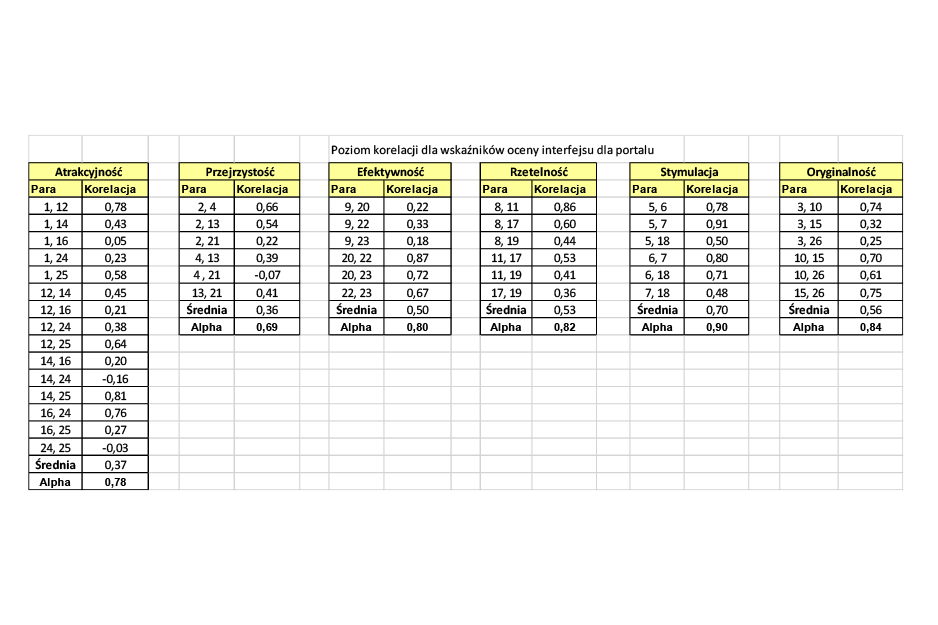
- Excel based set of calculation procedures is ready to use for presentation test results and data authentication
- Set of evaluation indicators contains 6 scales with 26 attributes:
- Attractiveness – Overall impression of the product. Do users like or dislike the product?
- Efficiency – Can users solve their tasks without unnecessary effort?
- Perspicuity – Is it easy to get familiar with the product? Is it easy to learn how to use the product?
- Dependability – Does the user feel in control of the interaction?
- Stimulation – Is it exciting and motivating to use the product?
- Novelty – Is the product innovative and creative? Does the product catch the interest of users?
Method objectives
- Estimating the efficiency of the communication skills and graphic user interface of the investigated product
- Achieving high credibility through consistency of declared and objective data
- Verification the ergonomic of use
- Estimating the logistic concept of user interface and navigation rules
- Recognizing emotions associated to performing the tasks the product was created for
- Comparing creator intentions with real comfort of use
- Identification of faulty and incomprehensible navigational structures, redundant steps and views
- Detection the gaps and weaknesses in presentation of key information
- Determining the global level of product attractiveness
- Estimating more specific indicators in terms of pragmatic (performance) and hedonistic (emotion) aspects
- Acceptance or not acceptance of the communication formula
- Choosing the best version
- Better understanding needs of potential users
User Experience Investigation Gallery
Download Interface usability study report
| Description | File type |
|---|---|
| Badanie użyteczności interfejsu v2017.08.25 |